Thursday, October 05, 2006

對沖基金與信評

對沖基金與信評

Hedge Funds' Next Wrinkle: Ratings


對沖基金最近已經夠倒楣了, 現在又出現了下一個難關 --- 信評.

我有一個很聰明又很會賺錢的朋友Aaron在對沖基金作的很好, 他曾不只一次在閒談中擔心對沖基金的好景不再. (那可是會破壞他在全世界各地置產的美夢的, just kidding, Aaron, if you are watching) 看來他的擔心是真的, 只是在那天來到前他可能已經賺飽退休了.

讀完此文我有幾點想法:
1. HF關起門來神秘兮兮搞的時代已經過去, 他們令人匪夷所思的管理費(1-2%+20% of profit over watermark)能繼續下去的時日應該不多了
2. 投資大眾被允許進入Hedge Fund/富人俱樂部(多少人有五百萬美元的"閒錢" liquid asset 呢)的時代即將來臨. 目前最大的障礙就是未知的風險.
3. 我的公司(作FI的風險管理)將會賺到許多HF的錢, 哈哈!
4. 惠將更有機會進入HF賺大錢, 哈哈哈!
5. Aaron快來請我家惠吃飯, 說不定她有一天會評等你的公司呢, 哈哈哈哈!
(original)

By SERENA NG and SHEFALI ANAND
August 25, 2006; Page C3

The country's largest credit-ratings services are taking steps to break into the potentially lucrative business of rating hedge funds.

The ratings firms believe that demand from big investors like pension funds for such assessments will spur more hedge-fund managers to obtain independent evaluations of their ability to steer clear of problems.

Moody's Investors Service, a unit of Moody's Corp., has spent much of the past year developing a model that rates "operational risk" of hedge funds -- essentially, the likelihood a fund will lose money or even shut down because of lax or fraudulent management -- and is expecting to publish its first such rating in the coming weeks. Meanwhile, Standard & Poor's, a McGraw-Hill Cos. unit that has provided credit ratings on a few individual hedge funds since at least 2000, is preparing to publish a set of criteria detailing how it will assess the risk of funds going forward.

The ratings firms are hoping to fill an information gap in an industry that is fast gaining popularity with a broader range of investors but remains largely shrouded in secrecy. Lightly regulated hedge funds now manage more than $1 trillion for wealthy individuals and large institutions.

Before putting money with a hedge fund, investors often perform checks on the fund, which may include visiting the fund manager and discussing its internal controls to prevent financial fraud and other risk-management strategies. Larger investors also contract outside consultants to conduct this "due diligence" work on their behalf. There are also a handful of private firms in the U.S. and Europe that provide independent certifications and reports on hedge funds' internal systems and controls, and now the ratings services want a slice of the pie.

The new Moody's ratings would address, among other things, whether funds are properly valuing their assets and whether they have adequate risk-management systems. It also plans to conduct background checks on individual fund managers, including their educational and professional qualifications, work experience, and any previous run-ins with the law. Such issues are of concern to investors in the wake of alleged frauds at firms like Bayou Management and Wood River Capital Management.

S&P's credit ratings on hedge funds -- most of which currently aren't public -- are meant to reflect the likelihood of a fund defaulting on loans made to it. They also take into account hedge funds' operational risk and consider whether a fund will be able to repay all its creditors if it has to liquidate its portfolio.

Fitch Ratings has put out credit ratings on a handful of hedge funds for several years, but like S&P, most of those ratings are private and can be viewed only by investors and institutions that hedge funds choose to share the ratings with.

Fitch, a unit of Fimalac SA of Paris, also does ratings on the operational risk of several hedge funds in Europe, and is looking to do this in the U.S., says Eileen Fahey, a managing director.

It is unclear if many hedge funds will step up to be scrutinized by the big ratings firms, as many continue to seek to avoid scrutiny by outsiders.

Write to Serena Ng at serena.ng@wsj.com1 and Shefali Anand at shefali.anand@wsj.com2

Covered Bonds

Covered Bonds

Washington Mutual to sell first U.S. covered bonds


美國終於要開始賣歐洲風行已久的Covered Bonds了, 還是由我們的一個大客戶發行的 (三家中的兩家IB也是我們的客戶呢, 哈哈).

什麼是Covered Bonds呢? 他基本上是一種新的,較便宜的集資工具,特別是跟發行公司債或甚至向政府機構借(經由FHLB的advance)比起來. Covered Bonds 的投資人有雙重保護: 對發行公司的要求權以及被發行公司當作抵押品的要求權. 由於以上的緣故, 今天一個信譽卓著的公司又有許多錢投資在證劵化商品(MBS, ABS, etc, 很多美國公司符合這個要求) 要借錢來從事一項新的產品開發, Covered Bonds 是最便宜的了. 一般而言發行公司只要提供比政府債劵多10-20 bps (0.1%-0.2%) 就夠了, 比公司債(AAA,2yr for 30-40 bps)低多了. 投資人也獲利, 因為他們可以幾乎零風險(跟政府債劵一樣)來拿到比政府債劵高0.2%的報酬率.

然而, 天下沒有白吃的午餐, 這款"好康的事"哪裡生出來呢? 答案是"公司的名號"(信用)以及"公司的基礎設施"(對抵押品的定價以及風險管理能力) 哈哈哈,這又是敝公司下去分一杯羹的時候了, 當然啦, 在三家投資銀行分完他們的份之後.

European Mortgage Federation上的介紹
By Al Yoon

NEW YORK, Sept 5 (Reuters) - Washington Mutual Inc., the third largest lender in the United States, will become the first bank in the nation to tap the growing covered-bond market by selling up to 20 billion euro of debt backed by home loans, according to Standard & Poor's.

Seattle-based Washington Mutual (WM.N: Quote, Profile, Research) plans by mid-month to access the 1.6 trillion euro market where it may see lower long-term funding costs than through sales of its corporate debt or advances from the Federal Home Loan Bank system, according to Todd Niemy, an analyst at S&P in New York.

Covered bonds differ from traditional mortgage-backed securities in that the debt remains on the company's balance sheet, allowing it to retain control over the assets. The bonds are secured by a portfolio of assets that in the case of the borrower's insolvency would be used to make payments.

The bonds will allow U.S. banks to diversify funding into a European market that has undergone a "renaissance" in recent years, S&P said. Germany, Spain and the UK have been particularly active issuers since 2004.

Washington Mutual "is taking advantage of an expanding European appetite for U.S. mortgage credit," Niemy said in an interview. "A lot more U.S. mortgage bonds are being purchased in Europe and Asia" and the covered bond sale is a natural extension, he said.

Washington Mutual will provide a mortgage bond backed by mortgages with fixed-interest for five years, and adjustable thereafter, as collateral for the covered bond, S&P said. A call to Washington Mutual wasn't immediately returned.

The "AAA" rated issue will probably trigger more covered bond sales by U.S. companies, S&P said. Washington Mutual itself will sell the bonds up to six times a year, S&P said, citing the company.

Barclays Capital, ABN Amro and Deutsche Bank are managing the Washington Mutual covered bond sale. (Additional reporting by Bei Bei She in London) (Reporting by Al Yoon, editing by Leslie Adler; Reuters Messaging: albert.yoon.reuters.com@reuters.net; email: albert.yoon@reuters.com; Tel: 646-223-6347))

original

羅賓漢傳奇

羅賓漢傳奇

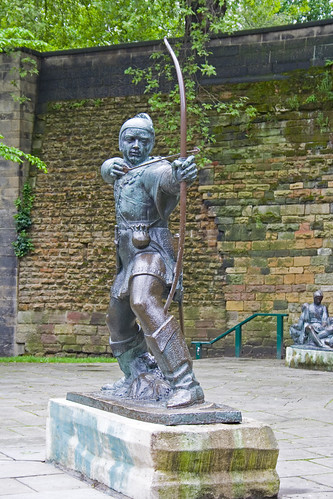
羅賓漢(Robin Hood)是所謂 "創投慈善事業"(Venture Philanthropy)的先驅.
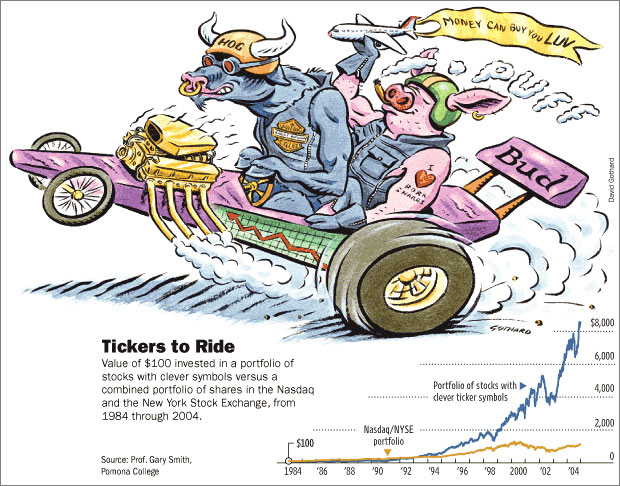
Venture Philanthropy 完全擁抱自由市場原則. 他們使用一套統一的"科學計量方法"來公平的評估每一個計畫的成效. 他們用的方法很簡單,每一塊錢的"投資"導致將來受幫助窮人加起來可賺回來的錢數. 使用這套方法他們可以比較兩個計畫的優劣然後將錢(有限資源)用在刀口上. 這跟他們run hedge fund的精神一樣 --- 用一個統一的定價方法在不同的asset class之間找出他們的相對價格, 然後買低賣高, 就這麼簡單.(see,你也可以開一家 hedge fund了)

通常好的project可毫無困難的拿到資源, 無效的則被無情的丟棄.

Robin Hood

這"計量方法"對一個以"對抗貧窮"為主旨的組織久多麼proper啊. 我想, 對於其他不同目的組織應該也不難去設計一套"計量化"的方法吧. 你要開一個"廖添丁"慈善組織嗎? 我可是有很多不錯的idea喔!


The legend of Robin Hood

A rebel's code


What makes Robin Hood different from other charities.

Every dollar counts


To entice donations, board members cover all administrative and staff expenses-meaning all contributions go 100% to fund programs.

Follow the metrics


Robin Hood spends more than $500,000 a year gathering data on the agencies it funds, and $300,000 on a staff economist who crunches numbers. Programs that don't satisfy their benefit/cost benchmarks are out.

Don't save your powder


Robin Hood doesn't have an endowment and doesn't want one: It aims to spend everything it raises each year.

Be cool


Poverty-fighting goals may be wonky, but Robin Hood's stylish courting of celebrities gives it unmatched cachet.

Power Players 看看這個董事名單吧!


The 28-member Robin Hood board has unmatched influence.

* Lee S. Ainslie III, Maverick Capital

* Victoria B. Bjorklund, Simpson Thacher & Bartlett

* Lloyd C. Blankfein, Goldman Sachs

* Peter F. Borish, Twinfields Capital

* Geoffrey Canada, Harlem Children's Zone

* Tom Brokaw, NBC News

* Maurice Chessa, Bedford-Stuyvesant I Have a Dream Program

* Richard L. Chilton Jr., Chilton Investment

* Steven A. Cohen, SAC Capital

* Glenn Dubin, Highbridge Capital

* Marian Wright Edelman, Children's Defense Fund

* Richard S. Fuld Jr., Lehman Brothers

* Jeffrey R. Immelt, General Electric

* Paul Tudor Jones II, Tudor Investment

* Peter Kiernan III, Cyrus Capital

* Marie-Josée Kravis, Hudson Institute

* Kenneth G. Langone, Invemed Associates

* Mary McCormick, Fund for the City of New York

* Doug Morris, Universal Music

* Daniel S. Och, Och-Ziff Capital

* Gwyneth Paltrow, Actress

* Robert Pittman, Pilot Group

* David Puth, J.P. Morgan Chase

* Diane Sawyer, ABC News

* Alan D. Schwartz, Bear Stearns

* John Sykes, MTV Networks

* Harvey Weinstein, Weinstein Co.

* Dirk Ziff, Ziff Brothers


The legend of Robin Hood


How the leaders of the hedge fund world have banded together to fight poverty - taking gobs of money from the rich, applying strict financial metrics in giving it away, and making philanthropy cool among the business elite


By Andy Serwer, Fortune senior editor-at-large

(Fortune Magazine) -- The idea behind one of the most innovative and influential philanthropic organizations of our time sprang from one of the more boneheaded macroeconomic calls ever made on Wall Street. Or as hedge fund maestro Paul Tudor Jones tells it, "The biggest error I've ever made had the best possible outcome."

The story begins in the summer of 1987. Stock prices were soaring, but so, too, were interest rates. The then 32-year-old Jones - who had made buckets of money during the go-go 1980s - was getting nervous. That September he told his investors that the stock market reminded him of 1929 and a crash was inevitable.

Even after October's brutal 23% one-day drop, Jones remained apocalyptic. He called up fellow hedge fund manager Glenn Dubin and pleaded, "It's happening. We're going into a great depression. We've got to do something about it. I want to start a foundation to help, and I'd like you to be involved."

Of course, Jones was dead wrong about a depression, but that hasn't mattered. He has gone on to become a Wall Street titan, with some $14.7 billion under management. More to the point, his brainchild, a charity called Robin Hood -which was born out of the direst predictions - has become a paragon, forging a new model for philanthropy and attracting heaps of cash from an enviable roster of high-profile benefactors.

In the broadest terms, Robin Hood does what its name suggests: It takes from the rich (especially its own board members) and gives to the poor. But even though its mission is focused-to fight poverty in New York City - and the roughly $525 million it has distributed pales in comparison to what Bill Gates and Warren Buffett have given, Robin Hood's influence is extraordinary.
Venture philanthropy

Robin Hood was a pioneer in what is now called venture philanthropy, or charity that embraces free-market forces. An early practitioner of using metrics to measure the effectiveness of grants, it is a place where strategies to alleviate urban poverty are hotly debated, ineffectual plans are coldly discarded, and its staff of 66 hatches radical new ideas.

It also has a radical approach to drumming up money. At first Robin Hood's donation base was limited mostly to friends of Jones's, which is to say, hedge fund managers like Dubin. Jones latched onto a clever financial model with obvious appeal to contributors: All the organization's administrative expenses are covered by Robin Hood's board members, meaning every penny donated goes directly to the cause.

Today Robin Hood is much more than a charitable organization. While it retains a strong hedgie flavor, its board is now a blue-chip collection of Who's Who in business and media that includes GE's (Charts) Jeffrey Immelt, ABC's Diane Sawyer, movie mogul Harvey Weinstein, and Lloyd Blankfein of Goldman Sachs (Charts), as well as leading lights from the nonprofit world like Marian Wright Edelman. Actress Gwyneth Paltrow is on the board too, and both the Rolling Stones and the Who have done fundraisers for the group.

Such connections have helped Robin Hood not only draw interest and money on a nationwide scale but become a gathering place for a new generation of rich and prominent Americans - a business and social network that reflects myriad intertwining relationships among board members, staff, grantees, and donors. As a significant benefactor of the organization puts it, "Robin Hood is like the cool table in the high school cafeteria."

It is not all fun and games. "It's a bigtime commitment," says Blankfein of his role as a board member. "These are serious, accomplished, dedicated people. They demand your brainpower." But the benefits and information can flow both ways. "I've been so impressed with the metrics they use," says GE's Immelt. "There's a lot we can learn from that for the GE Fund and the GE Foundation."

In fact, nonprofits around the country study and borrow from Robin Hood's programs, and copycats have sprung up in London and San Francisco. Perhaps most important, Robin Hood has brought the idea of philanthropy to a younger generation of superwealthy Americans who might not otherwise have considered it. Says board member Tom Brokaw: "Every community could have a Robin Hood-like operation. It wouldn't be as large or as well-heeled as New York's is, because it's like Willie Sutton said, That's where the money is. But when I talk to people in Denver and Memphis and other places and I tell them about Robin Hood, their eyes light up."
Kicking out the drug dealers

I recently ventured to the Bedford-Stuyvesant section of Brooklyn to meet Paul Jones at the Excellence Charter School for boys, an institution that Robin Hood supports and that in many ways reflects its workings. The school is the product of a pooling of dollars by the New York City Board of Education, Robin Hood, and Jones personally, plus contributions from a variety of corporations.

The school's physical plant, including a fabulous AstroTurf roof, would be the envy of any $30,000-a-year private school. Inside, groups of energized young teachers and little boys, kindergarten through second grade (and 100% minority), in white shirts and ties, ready themselves for the coming school year. Principal Jabali Sawicki tells me there is a 170-student waiting list.

Just a few years ago this building was a neighborhood eyesore, a symbol of all that had gone wrong in Bed-Stuy. Originally constructed in the 1880s as PS 70, and later used as a yeshiva, it became a home to drug dealers and prostitutes after a fire in the 1970s - even a venue for illegal cock fights.

Then, in 2004, another organization that Jones supports, Uncommon Schools, committed $30 million ($6 million from Jones personally) to buy and renovate the property. David Saltzman, the executive director of Robin Hood, persuaded Robert A.M. Stern, dean of the Yale School of Architecture, to design the facility, which was completed this spring. Signs throughout the school were done gratis by renowned design firm Pentagram. And Robin Hood sent a check for $150,000 for the school's operating budget. Books were donated by Scholastic (Charts) and HarperCollins, which have given a collective two million volumes to Robin Hood - and which explains why my arm is resting on a pristine copy of Harry the Dirty Dog as I interview Jones inside a classroom.

Jones, 51, who is as press-shy as he is charismatic, is said to have earned $500 million last year. He was raised in Memphis and educated at the University of Virginia, where he donated $35 million toward a new basketball arena, which opened in July. He's also invested tens of millions to build a nature preserve in Tanzania.

But it is here in Brooklyn that Jones pursues his biggest passion. "I love education because I love kids," he tells me in his assertive drawl. "If I retired, I'd love to teach second, third, or fourth grade. I also like education because I think it has the greatest multiplicative powers in terms of the ultimate good you're going to do for the hours and dollars expended."

Robin Hood gave grants to 21 charter schools as well as 24 regular public schools in 2005. "Fifteen years ago the only way you could impact inner-city kids who didn't have proper educational services was through an after-school program, which is a very poor substitute for a great school day," Jones says. "That changed because the charter movement began, and so my priorities shifted."

Don't charter schools draw precious resources away from other public schools?

Jones makes no apologies: "Charter schools are the best thing that ever happened to education in New York City because they provide competition to regular public schools and raise the bar that everyone is trying to attain. They provide thought leadership for other schools, so again there's a multiplicative impact."

The Excellence school, which falls under what Robin Hood calls its education portfolio, is one of more than 200 programs that it funds in New York City -everything from soup kitchens, job training for ex-cons, and housing for the homeless to financial service centers for the poor, where they are instructed on how to apply for the earned-income tax credit. (In 2006, Robin Hood helped poor working families claim $98 million in tax refunds.)

One of its first grantees: the Association to Benefit Children (ABC), an immaculate and warm day-care center for the city's most needy kids. ABC is also where board member Marie-Josée Kravis - economist and wife of buyout king Henry Kravis - first became enamored of Robin Hood, even after a little boy asked on her first tour what color underwear she was wearing.
Benefit to the poor per dollar of cost

Robin Hood's relationship with its grantees is not unlike that of a private-equity fund or an activist hedge fund. If the client organization is thriving, Robin Hood helps guide expansion efforts. If it is struggling, Robin Hood digs in, sending consultants and meting out advice on office space and leases, technology, legal, and HR. It has a program that matches interested businesspeople with nonprofit boards that need boosting. It will recommend new executive directors. It has solicited donations of professional services from the city's top law firms and the likes of Deloitte & Touche, GE, and Microsoft (Charts). "With Robin Hood, there is constant evaluation," says board member and grantee Geoffrey Canada, whose Harlem Children's Zone has adopted 60 blocks in Harlem. "It is a rigorous - and can be an exhaustive - process."

In some cases the evaluation is simple, and the choice is obvious. The head of a drug-treatment program is found using drugs: Goodbye. But in most cases Robin Hood relies on a complex system of metrics, which calculates the success of a grant by estimating its benefit to the poor per dollar of cost to Robin Hood, much like a business's rate of return.

Robin Hood hires an outside evaluation firm to collect data from each grantee. In 2005 it paid $552,000 to Philliber Research Associates for this service. The numbers come back to Robin Hood and are then crunched by chief program officer Michael Weinstein, an MIT-trained economist (and also a former editorial writer for the New York Times).

"We set out to compare the relative return of any two grants, no matter what their purpose, much the way an investor compares the relative return of any two investments," says Weinstein. "For most of our grants, our basic measure of success is, How much does our grant boost early adult earnings of poor individuals?" To estimate earnings, Weinstein taps into statistics and data from many sources. "A benefit/ cost ratio of five," he explains, "means that for every dollar Robin Hood contributes to the program, collective earnings of the poor individuals served by the program rise by $5. As a ratio, the benefit/cost calculation can be used to compare the value of any two grants, no matter their purpose." In effect, Weinstein is saying, his model allows Robin Hood to compare apples and oranges.

These metrics help Robin Hood identify programs that aren't worth the investment. Say it gives a grant of $150,000 a year to a charter school in Harlem that produces a benefit/cost ratio of six (i.e., every dollar Robin Hood spends on the school purportedly boosts the future earnings of the students by $6 a year). That compares with a $125,000-a-year grant that Robin Hood used to make to a Bronx afterschool program that emphasized the creative arts, which scored only a 0.6. Robin Hood supports a job-training group in Brooklyn that scores a nine, as well as one in Manhattan that scores only a 4.5. But that's because the Manhattan group serves ex-cons, so lower-paying jobs are to be expected.

Does the Robin Hood board cut grantees loose? You bet. Each year roughly 10% lose funding. "They size these agencies up in a gimlet-eyed fashion," says Tom Brokaw. "It's like going to a GE division meeting."

Is it right to treat philanthropy like a business? Or is this just another example of a free-market mentality overriding a pure sense of compassion? To hedge fund manager and former Robin Hood chairman Stan Druckenmiller, who remains a key benefactor, that's ridiculous: "If you spend a dollar on something that doesn't work, why continue? This is about trying to solve poverty, not applying Band-Aids."

Adds Marie-Josée Kravis: "Measuring is appropriate as one instrument of understanding. When you look at corporations, you don't look only at their earnings. You look at their product pipeline, the quality of their management, their labor relations-things you can't measure precisely. And it's the same in the nonprofit world. It's important to understand, to the extent that we can, how effective our dollars are."
One prison's high school

On a muggy afternoon in the middle of June, I drove to Rikers Island - New York City's massive jail complex - with Beth Navon, executive director of Robin Hood grantee Friends of Island Academy (FOIA). Robin Hood gave $350,000 this year to FOIA, which offers advice and support to youth incarcerated at Rikers.

Robin Hood also placed hedge fund manager Anne Dias Griffin, wife of Ken Griffin, who runs the mega Citadel hedge fund company in Chicago, on the FOIA board. Navon and I are met at the jail by Tongo Eisen-Martin, a FOIA staffer who has a master's degree in African-American studies from Columbia. As we descend into the bowels of the jail and surrender first our cellphones, then our IDs, my heart begins to race. I'm handed a temporary ID.

"Don't lose that, or we have to strip-search the entire jail," a guard warns me. Gotcha. One of FOIA's programs is running a high school inside Rikers, and one of those classrooms is our destination. Eisen-Martin, who teaches slam poetry, on this day decides to turn the class into a Q&A session. With me.

Immediately I'm surrounded by prisoners who grill me about the war in Iraq, Bill Gates, and racism. After an hour of nonstop questioning by what I later learn is a group of especially violent prisoners (two of the most curious happen to be alleged murderers), with no guards in sight, it's time to go. "If you can give these kids any bit of knowledge, you are helping them," Eisen-Martin tells me. "You never know what will trigger something good inside of them." I nod, but I'm wrung out and anxious to get home. Besides, I have a Robin Hood party to go to that night - an experience that couldn't be more different from Rikers.
"You gotta give, baby, give!"

"All right, who's getting indicted here?" Jon Stewart screams at the crowd of 4,000 of the New York area's wealthiest citizens, who chuckle, perhaps a bit nervously. Robin Hood's annual benefit dinner at the Jacob Javits Center, emceed by Stewart and Tom Brokaw, is considered by many the party of the year. It would be impressive enough for its very A-list crowd - everyone from Mel Karmazin to Mark Cuban to Matt Lauer - but even more remarkable is the astounding amount of money it raises.

Most charity dinners in New York are considered a smash if they bring in $1 million. Here success is measured in tens of millions. "If you are on Wall Street, particularly in hedge funds, you have to be here," says one of my tablemates.

The real action begins after Stewart's shtick, when Sotheby's Jamie Niven takes the stage to lead an auction unlike any other. The bidding-on a glam vacation package for eight to Mexico, Montana, and the Bahamas, for instance - is done with glow sticks and repeatedly hits the mid-six figures.

The power tables with the real heavy hitters - "billionaire's row," a friend calls it -are close to the stage. One table's guests have brought their primary-school-age kids and, amazingly, let the youngsters themselves bid for a package, as if it's some kind of game-even as the numbers top $300,000. (A Robin Hood board member next to me groans.) Stewart can't help a gibe: "Come on, kids, you can do better than that!"

At a break in the auction, a group of charter-school students perform a rap orchestrated by Jay-Z. "Read, baby, read," the kids chant. "You got to read, baby, read." Minutes later Paul Jones bounds up on stage and does his own Southern-man chicken-dance version: "You got to give, baby, give," Jones intones. "The more you give, the better you feel. The better you feel, the better you'll trade."

The crowd knows what's coming now: the serious money part of the auction. Robin Hood is raising funds to build a charter high school. "We are looking for a couple of $1 million bids for naming rights to the school's large facilities," announces Niven. And the sticks go up. Twelve of them. Niven and Jones then drum up 30 bids of $250,000 each for classrooms.

To reward all that giving, there's a performance by Beyoncé to end the evening. The final tally? In a single night Robin Hood hauls in $48 million. Some $20 million is earmarked for the new school - which will be matched by the board, $2.25 for each $1. And New York City schools chancellor Joel Klein, who at one point during the gala, at Jones's urging, stands and takes a bow, has said the city, in turn, will match the combined sum (as well as the amount of a tax credit). Overall, the $20 million for the school will grow to $180 million. The cost to put on the dinner? Around $5.6 million.

Robin Hood's fundraising machine is always in operation. It sells holiday cards and offers an online registry, which allows you to give a gift in someone's name to Robin Hood instead of buying a $5,000 espresso machine. Robin Hood's LemonAid program has kids from affluent families selling lemonade in Greenwich, Scarsdale, and the Hamptons. Last year it raised $120,000.

Robin Hood throws what it calls heroes' breakfasts to honor individuals who have dedicated their lives to fighting poverty - like Ellen Baxter of Broadway Housing, which provides apartments for the homeless - and to raise more dough. "Gwyneth Paltrow and I sat next to each other and cried at the last one together," Joel Klein tells me. And indeed, it's hard not to get choked up. (At the Baxter breakfast, a young woman described how she watched her mother die in a shelter before they were able to get a home.) "Stan Druckenmiller, Paul, they all cry," says a Robin Hood staffer. "You would too."

Then there are one-off events: The Rolling Stones played a benefit at Radio City Music Hall this spring, which raised $11 million - Harvey Weinstein even got the notoriously tightfisted band to donate $500,000. The Who played the Robin Hood gala in 2000. Why? "Because I adore and totally trust the people involved, like Harvey Weinstein and [Universal Music CEO] Doug Morris," says Pete Townshend. "Am I insane?" he asks. (Sure, Pete.)

Townshend continues: "[Robin Hood] reaches street level. That's all that matters to me." Townshend was also a headliner at the Concert for New York after 9/11, which, unbeknown to most, was orchestrated by a quartet of Robin Hood board members: Weinstein, Morris, John Sykes of MTV Networks, and former AOL chief Bob Pittman. "This show was a deeply disturbing event," says Townshend in an e-mail. "I was there to express rage at the terrorists and sympathy for those who died. I still believe the message we sent the world at the concert was a realistic one: We are vulnerable, but we are also incredibly strong - probably best not to f**k with us like this too often."
A society of peers

One of the most influential figures on Robin Hood's board was John F. Kennedy Jr., who died in July 1999. Brought on by Robin Hood's executive director, David Saltzman, who was a college friend at Brown, Kennedy helped entice Marie-Josée Kravis onto the board.

Tom Brokaw was drawn in after hearing Kennedy talk about Exodus House, a middle school for low-income families and a grantee of Robin Hood. After Kennedy's death, Brokaw became involved in Exodus "to kind of honor his life." Brokaw's friend Pittman then convinced the former news anchor to join Robin Hood's board. It's a small world at this altitude, and when you tick through the list of Robin Hood board members, it quickly becomes apparent that they are all connected.

Dubin was previously married to David Saltzman's sister. Tiki Barber of the New York Giants, who is on Robin Hood's leadership council, tells me he was introduced to the organization by Jonathan Tisch, whose family is an owner of the Giants - plus Barber played college football at the University of Virginia, Jones's alma mater. David Puth is a senior executive at J.P. Morgan, the bank that two years ago bought a majority stake in Glenn Dubin's hedge fund, Highbridge. And Gwyneth Paltrow and Harvey Weinstein are pals from way back.

Connections also provide Robin Hood with access to the world's hottest hedge funds. At the end of 2005 it had $177 million invested in funds run by board members Jones, Dubin, and Steven Cohen of SAC Capital as well as Eddie Lampert's ESL, Citadel, D.E. Shaw, and others.

Is it prudent or a conflict of interest for a philanthropy to invest in risky hedge funds, some managed by its own board members, many of which would be inaccessible to other charitable organizations? David Saltzman says no, and that these decisions are carefully reviewed to make sure they are consistent with regulatory guidelines.

Robin Hood's powerhouse board meets regularly four times a year at grantee sites. "When we get in a board meeting, everyone is a peer," says board member and hedge fund manager Lee Ainslie. "The people from the media, entertainment, nonprofits, and finance. No one dominates the discussion."

The vetting of grantees is painstaking and continual, in part because of the way Robin Hood's funding and disbursement works. For instance, all the money raised in one year, which in 2004 was $81 million, is doled out in the following year, in our example 2005. Yes, there is a reserve fund (the money invested with the hedgies), but there is no endowment. "Why put away money for a rainy day when it's pouring out?" asks Saltzman."New York City is arguably the richest city in the history of the world, and yet the majority of babies were born into poverty last year. Why would we keep powder dry under those circumstances?"

Some Robin Hood staffers are paid quite well-Weinstein, for one, earned some $300,000 in 2004 - although hardly what they might earn at one of the board members' hedge funds. Still, Robin Hood has attracted all manner of high-powered execs, such as Susan Sack, a former lawyer at Sullivan & Cromwell and a onetime Goldman Sachs employee, who now helps grantees navigate the devilish New York real estate market. Others come from firms like McKinsey, PricewaterhouseCoopers, and Accenture. "These are people who could have incredibly high-paying jobs anywhere, and yet they chose to do this," says David Saltzman. "And believe me, the quality of employees here is the same as at a Tudor or a Goldman."

Several years ago a staff member proposed funding a needle exchange, where drug users could turn in old hypodermic needles for new ones (or simply pick up new ones). Fresh needles help prevent the spread of HIV/AIDs. A vigorous debate ensued on the board. "Why don't we throw in a couple of hits of acid too?" Jones asked sarcastically. But to Druckenmiller and others, the issue was a matter of money: It's far cheaper to provide free needles to addicts than it is to care for an AIDS patient.

The pros won out, and on a recent boiling-hot afternoon, I visited a needle exchange that received $350,000 from Robin Hood this year, located in a small storefront on Manhattan's Lower East Side. Drug users slouched in throughout the afternoon, selecting needles (from three sizes), works, and other neatly packaged paraphernalia. In a second room, junkies nodded off on couches in front of a TV. (They are prohibited from shooting up there.) It is a shocking and powerful scene, and yet to supporters of the program, absolutely necessary.

The evidence they cite: In 1992 the HIV rate among New York City drug addicts was 52%. Subsequently, needle exchanges were introduced, and now the rate is 14%. "I have a soft spot for children's programs," says Glenn Dubin, "but the needle-exchange program also resonates with me because I think we did something very bold."
Keep your checkbook open

"I grew up in Washington Heights, so I do feel a real affinity with the work that we're doing," Dubin says. For Paul Jones, an out-of-towner, the motivation is slightly different: "All my success was gained basically in New York City, and this was my way of repaying New York. I couldn't have done what I did anywhere else in the world."

Jones's gift extends well beyond the tens of millions of dollars in checks he's written. "Paul's genius was that he created an organization that didn't have his name on the door to make it easier for him to entice people to join Robin Hood, not only for their money but also to contribute their time, energy, and brainpower," says David Saltzman. "It wasn't about his ego - it was about trying to do good."

Folks at Robin Hood insist that their mission has just begun. They say that one in every five New Yorkers lives in poverty and that the foundation must get bigger to meet this challenge. That means raising more money. And they know how to push for it.

One Robin Hood supporter who'd had a particularly good year says he was told that there were no $30,000 tables available for this year's benefit dinner, only $50,000 tables. "They wanted him to step up," says a colleague and fellow Robin Hood supporter. "I think they keep tabs on how well we are doing."

According to board member Ainslie, there are also new fundraising sources to be tapped-executives in real estate and Fortune 500 companies, for instance. "When we tell people their dollars are going to help their city, that every cent goes to those in need, that the board pays expenses, and that we hold our grantees accountable, you are talking about very powerful selling points," he says.

Robin Hood will need them, because with each year the organization gets in deeper and deeper. Robin Hood's momentum will continue to push the group forward. With huge capital projects like the Excellence school, simply maintaining these facilities will cost millions more each year. "Poverty is a growth business," Jones tells me. The good news is it seems that the best and brightest minds on Wall Street and in business are starting to do something about it.

Reporter associate Corey Hajim contributed to this story.

名字影響表現?

名字影響表現?

Is a Catchy Stock Symbol a Boon?


tickers_to_ride

Princeton University 及 Pomona College 分別對股票的短期及長期表現做研究後發現股票的代號取得有意義的比那些代號毫無意義的股票要表現的好. 有哪些例子呢? 哈雷機車的代號是HOG(豬), 蘇世比是BID(競標), 先進醫療光學是EYE(眼), 特級標準農場是PORK(豬肉), ...

Princeton 研究了800+個 在1990年及2004年間發行的股票, 他們把股票分兩組: 唸的出來的一組(如RAD或任何上述例子), 唸不出來的另一組(如RDA). 好唸的一組平均在第一天(IPO)後比另一組平均多上漲了8.5%. Wow!

另 一個Pomona College的研究更驚人. 史密斯教授請參與問卷的人從1984年到2004年間發行的股票中選出名字取的好的, 例如Anheuser Busch的BUD(百威啤酒), 西南航空的LUV(愛), 大哈瓦那菸草的PUFF(吐菸), 及Lion Country Safari的GRRR(肉食動物的低吼聲). 他們在那20年間平均每年賺進23.6%, 相對之下所有股票平均只賺進12.3%.

Efficient market hypothesis失靈了嗎?
替公司用心選取好股票代碼的經營團隊較用心經營公司嗎?

我們是不是可以把這個發現用於台灣的股市呢? 同樣的情況下, 4321, 2222, 3456 是否比 2352, 3491, 7630 等股票漲的快呢?

原文

Does Stock By Any Other Name Smell as Sweet?


Catchy Symbols Such as HOG
Help Likes of Harley-Davidson,
Yum, at Least in the Early Going
By JENNIFER VALENTINO
September 28, 2006; Page C1

For at least two years, Harley-Davidson Inc.'s investor-relations folks had thought about it: Their ticker symbol, HDI, wasn't exactly evocative of the motorcycle maker's image. And there was something better available: HOG, biker-slang term for a Harley motorcycle.

Something surprising has happened since Harley-Davidson adopted the symbol in mid-August: Its shares have gained nearly 16%, compared with about 4% for the Standard & Poor's 500-stock index.

It wasn't the first time a stock has risen after adopting a catchy ticker symbol. Counterintuitive as it may seem, research suggests that companies with clever symbols do better than other companies. Any suggestion of a cause-and-effect relationship may be hokum, but tickers that make investors chuckle -- think Sotheby's BID, Advanced Medical Optics Inc.'s EYE or the apt PORK of Premium Standard Farms Inc. -- also may make them richer, at least for a time.

The studies do nothing to prove that a stock's ticker symbol has any influence on its price, and a ticker symbol certainly shouldn't rank high on an investor's crib notes for stock-picking. But the research may offer some insight into investor psychology and the importance of being memorable.

In one study, published in June in the Proceedings of the National Academy of Sciences, researchers at Princeton University found that companies with pronounceable symbols do better soon after an IPO than companies with symbols that can't be said as a word.

Princeton's Adam Alter and Daniel Oppenheimer looked at nearly 800 symbols that debuted on the New York Stock Exchange and the American Stock Exchange between 1990 and 2004 and divided them according to whether their symbol was pronounceable (like Rite Aid Corp.'s RAD) or not (like Reader's Digest Association Inc.'s RDA). They found investing $1,000 in the pronounceable stocks at the start of their first day of trading would have made you $85.35 more in that day than investing in unpronounceable ones.

A separate study suggests even longer-lasting effects. Pomona College finance Professor Gary Smith asked participants to rate ticker symbols according to "cleverness." From 1984 to 2004, a portfolio of stocks people considered the cleverest returned 23.6% compounded annually, compared with 12.3% for a hypothetical index of all NYSE and Nasdaq stocks. The clever stocks included such well-known stocks as Anheuser Busch Cos.. (BUD) and Southwest Airlines Co. (LUV), along with companies eventually delisted or acquired, such as Grand Havana Enterprises Inc. (PUFF) and Lion Country Safari (GRRR).

"A couple of these symbols crossed my path, and I thought 'Why do people do this? Just to be cute?' I really didn't know how this was going to turn out," said Prof. Smith, who wrote a paper on the study with two students and is submitting his findings to journals for review. Of course, not all of the companies with cute symbols did well. Concord Camera Corp. (LENS) did worse than the index for the period of the Pomona study.

Usually, ticker symbols are simply an abbreviation of the company name. Originally, they weren't even developed by companies, but by telegraph operators who were trying to save time as they transmitted data. One-letter tickers like C, the ticker symbol for Citigroup Inc., have long been considered the most valuable.

"It was a lot like what we do today with email and text messaging," said Shawn Connors, whose Stock Ticker Company makes historical replicas of ticker machines. "They had to come up with shortcuts for saying things."

Today, new companies submit their ticker-symbol preferences to an exchange for approval, and their requests are usually granted as long as the requested ticker isn't already taken.

Sometimes, when more-obvious choices are gone, a company is forced to come up with something less conventional -- and more clever. Town Sports International Holdings Inc. (CLUB), a fitness-club company that went public on June 2, chose a descriptive symbol only after learning that TSII was in use.

"We thought it would be good for people to have something they could easily remember," said Robert Giardina, the company's chief executive.

Some companies are more deliberate in aligning their ticker symbol with their brand. Yum Brands Inc., which runs restaurant chains including KFC, Pizza Hut and Long John Silver's, actually changed its name in 2002 in part to reflect its ticker symbol, YUM. The company, formerly known as Tricon Global Restaurants Inc., is trying to attract individual investors by advertising its name and ticker symbol at events such as the Kentucky Derby.

"It's easy for people to remember and puts a smile on their face," said Virginia Ferguson, a Yum spokeswoman. With a share price of $53.01, the stock is up about 230% from its 1997 debut price of $16, adjusted for splits, and has risen 68% since the name change to Yum Brands.

The idea that clever or pronounceable ticker symbols might better stick in investors' memories is an important component of both recent studies. Neither report proves causality, but one possible explanation for the results is that people prefer to work with information they can easily process.

When faced with complicated information -- say, stock listings -- people have a tendency to rely on mental shortcuts to simplify things. This leads them to develop "naive theories," said Princeton's Mr. Alter, a graduate student who did his research with Prof. Oppenheimer under a grant from the National Science Foundation to study how people react to differences in "fluency," or the ease with which information is processed.

Mr. Alter explained that people are more likely to believe that fluent information is true and that they have seen it before. For example, test subjects consistently rate the phrase "woes unite foes" as more true than "woes unite enemies," because the rhyme in the first phrase makes it easier to comprehend.

"It is possible that [people] are initially more attracted to fluently named stocks, that they pay particular attention to those stocks, or even that they favor those stocks because they have developed an association between easily processed names and success," he said.

Prof. Smith suggests another possibility: that clever ticker symbols could indicate something about a company's management or marketing team that turns out to be important to the stock's performance.

"Maybe it's a weird marker. Maybe it doesn't show up in the balance sheets and profits and losses when the companies start out," he said.

Prof. Smith said he believes the results raise doubts about the efficient-market hypothesis, the theory that stock prices reflect all known information and that it isn't possible to consistently beat the market without inside knowledge. A stock's ticker symbol is public information, so, under the hypothesis, differences in symbols shouldn't be tied to share performance.

Michael Cooper, an associate professor of finance at the David Eccles School of Business at the University of Utah, who has studied investor behavior, said that both papers were "intriguing," but that he would need to see further study before accepting the results.

"It doesn't mean there isn't some truth to them," Mr. Cooper said. But he said both studies need to more carefully control for fundamental differences among the companies studied to determine whether ticker symbol alone accounts for differences in performance. A stock with a hard-to-pronounce ticker might just happen to underperform a cleverly tickered stock simply because it is poorly managed.

And he thought the Princeton paper in particular could have a problem with "survivorship bias" because it dealt only with stocks for which activity was recorded a year after their entry into the market, possibly excluding poorly performing stocks that were delisted or otherwise disappeared before the year was up.

The researchers themselves say it probably wouldn't behoove investors to make decisions based on their studies. The effects in the Princeton study were statistically significant only for the first day of trading in a company's stock. And both studies were backward-looking, so there is no guarantee they could predict future results. Town Sports' stock, for example, has fallen as low as $10.74 from its opening price of $13, despite its catchy symbol.

"We certainly don't recommend that people make trading decisions based on our findings," Mr. Alter said. "Rather, our findings suggest that economic models should take psychological factors...into account if they are designed to faithfully capture how the markets operate in practice."

Write to Jennifer Valentino at jennifer.valentino@wsj.com

Love Story

Love Story

愛的故事 --- 華爾街quant版. 這是從 Emanuel Derman 處轉載. Derman這個人有一種geek式的幽默, 看不懂這篇文章請不要罵我, 這原來就是寫給華爾街的人看的.

Love Story


Recently, I received the letter reprinted below.

Dear Mr Derman,

You are always writing about the difficulty of being a good quant, but it’s not that hard. Read please my story and don’t be so serious!

I have come to New York with a PhD from ********. Quickly, I answered an internet ad by a chasseur de tête who sent me to a foreign bank.
Two interviews and I aced them all. A week later, I’m on the desk. “Dude, you are getting a Dell!” I say to myself.

With my scientific PhD, I find option theory easy as π. I have studied heat conduction and quantum mechanics so I quickly comprehend the options: α is intercept, β slope, Γ curvature,∆ tangent, σ temperature, θ sensitivity, µ drift. If I know derivatives, I know Derivatives. Soon I am an expert at Black-Scholes and Beyond. Yield curves are strings. Feynman to me? Kaç to you! Everything’s an option. I am one dynamic hedger, man.

On the prop desk my boss is Alden, an MBA, and I’m his quantitative guy. He calls me a geek; he knows no math but he sure knows business; he can use the same word as noun, adjective, exclamation and gerund in single sentence when he’s angry. Alden’s risque assistant is Lidia, a truly exotic option, a total knock-out with a non-normal distribution which makes the option salesman whistle and mutter softly about barrier penetration.

I have rational expectations for Lidia but I feel she don’t respect me. She like old movies but has no taste for mathematics and its beauty. To her I am far out-of-the-money.

Now the bank wants to do structured products. I have Excel, I buy VBA, I get models from optionmodels.com and now I’m in business. We’re doing long-term puts and calls, down-and-outs, converts, one-touches, spread options, CDS, vol swaptions, whatever, and I’m getting all the prices. I find model for anything. Easy as Dell. Once a week we run my spreadsheet to mark the book. Big P&L fast. Then late dinner with Alden at Bouley or Jean-Georges.

But always Lidia’s on my mind. When I watch her wandering across the floor, I cannot but think of excess kurtosis. I try to cliquet with her for coffee but she DK my trade. I sense there is little chance of a transformation between her p-measure and my q-measure.

One day someone offer Alden a big position in spread option barrier reversal American no-touch interest rate euro swaptions, denominated in Turkish lira. According to my model, these Sobranies are pretty cheap. Lots of α, high κ, big Sharpe. Alden take $100 million face for the desk and his boss bought some for his own PA too.

Next day the broker offered us much more at the same price – great deal! Each day’s close I tell Alden how my model says to rehedge the Eurodollar futures and the lira, and then we execute. Except I am always thinking sadly about Lidia, dreaming of her capital assets. Will I ever know her efficient frontier?

Next week comes by the head of model risk, ENS graduate Dr Jean-Martin Geille, an expert in Malliavin calculus. And Vlad, chief risk modeller.
“Your VAR is way up, mon ami,” said J-M to Alden, very loud. “What model ‘ave you used for the Sobranies?”

My model is one-factor Monte Carlo with control variate, $125 from the web. Vlad’s is three-factor Crank-Nicolson PDE with fat tails and LU decomposition, he tells me, written in
Java on his Linux laptop. His say we have a lot less α than mine.

“You pay too much µ for too little κ!” say Vlad.

“What’s it all about, α?” Lidia sings in her deep voice. She cannot understand the situation is serious.

But J-M does. “I am arrestin’ you for ze future mis-markin’ of complex instruments,” he yells, waving his hands as he jumps in front of Alden.
He joke, but Alden doesn’t laugh. He knows J-M would do anything to make risk department look good. We are ε away from big trouble.

That night the risk committee uses Vlad’s model. Their report shows big drop in our marks. “No-one knows what this is really worth,” moans Alden.
“We’d better unwind and cut our losses. No Zermatt this Xmas ...” Bonus day is only a month away.

So much volatility is difficult to concentrate... At the close I execute the end-of-day Eurodollar hedge and leave lira rebalancing for next morning.

When I get to work Alden is popping.

“Did you hedge last night?” he yell.

“Eurodollars yes, lira no!” I say.

“Great!” shout Alden. “Trouble in the Middle East – 7 percentage point drop in the Turkish lira overnight. The Sobranies knocked in. How’d you guess?”

“I been learning extreme value theory,” I tell Alden.

“Good call, guy!” he say as he squeeze my shoulder.

The Sobranies triple and we close out. I make 20 units for the desk.

Lidia looks at me with new respect. On bonus day I invite her to dinner at Jean-Georges.

“How did you do it?” she smile at me over the Petrus ‘85.

I can see our implied correlation is approaching unity and I am ready to early exercise.

“Behavioural finance,” I tell Lidia as I take her hand. “The market is like a shy woman who suddenly find she’s beautiful: slow to passion but fiery when aroused...”

Soon perhaps I start my own market-neutral hedge fund, offshore. Meanwhile, I hope my story encourage your readers.

Yours,

D***** B*****

Emanuel Derman is a professor at Columbia University and a former head of the quantitative strategies group at Goldman Sachs. This is one in a series of quarterly columns.
Email: emanuel@ederman.com

Thursday, May 11, 2006

Calm in a tempest

The approach to fixed-income: Smooth, steady
Tuesday, May 02, 2006
BY GREG SAITZ
Star-Ledger Staff

Coffee in hand, Robert Tipp wanders the floor of Prudential Financial's fixed-income trading desk with the casual air of someone taking a stroll on a sunny spring day.

The desk's chief investment strategist oversees hundreds of trades each day involving billions of dollars. He must keep up with the machinations of the U.S. markets and those around the world. Yet Tipp appears tranquil.

"That," he says, calmly, "is an illusion."

Despite whatever internal hurricanes may be swirling, Tipp's outward control of emotions seems to parallel an investment approach inherent in fixed income -- smooth and steady. For those who have $170 billion invested with Prudential in fixed-income products, it is a tact they no doubt appreciate.

"We do our best to keep risks under control," Tipp says. "People (traders) are intense. Basically you're being forced to make decisions in portfolios where you don't know what's going to happen in the markets, what's going to happen in the world."

Still, traders of fixed-income investments -- bonds, mortgages, currency and the like -- seem less boisterous at work than their stock-trading brethren. During a visit to Prudential's fixed income trading floor tucked into the third floor of Gateway Center II in downtown Newark, there were just a couple of raised voices from the 50 or so traders spread out on the L-shaped trading floor.

Different clumps of desks focus on various types of fixed-income investments, ranging from high-yield bonds to emerging markets, from U.S. government bonds to money markets. Most of the traders have either two or three flat-screen monitors on their desks, pulsing with continuously changing market data, risk measures for specific portfolios and messages from brokers on Wall Street executing orders.

The billions of dollars they are investing comes from Prudential's insurance division, as well as large institutions such as pension funds -- both outside companies and city and state governments. In addition, the traders manage money for Prudential's JennisonDryden mutual funds.

Late last month, Tipp and the others prepared for the release of two economic indicators: consumer confidence and existing-home sales. The news, released about 10 a.m., showed consumer confidence rose unexpectedly to an almost four-year high. Home sales also managed an increase.

Jumps in either report generally aren't good for bonds, and yields on the 10-year Treasury notes immediately increased, sending bond prices down.

"In the stock market, good news is good news," Tipp says. "In the bond market, bad news is good news."

But Tipp and Ellen Gaske, a market economist for the desk, weren't too concerned. Tipp says individual reports don't generally drive a wholesale change in their investing strategy.

That doesn't mean, however, traders didn't try to use the reports to their advantage.

"I was doing some trades as the numbers came out, sort of anticipating," says Peter Cordrey, a managing director who oversees U.S. Treasuries, high-yield bonds and other investments. "Every time the prices change, it affects valuations, but it also offers opportunities."

Those opportunities may not be in the bond markets, but Tipp says some emerging global markets might be attractive. That's where David Bessey focuses his attention.

Bessey, who heads the emerging markets desk, says bond yields are about 15 percent in Brazil, as high as 14 percent in Turkey and about 9 percent in Mexico.

"All of these seem like pretty good opportunities to us given the lower yields we're finding in other parts of the developed world," Bessey says. "The risk you take in each of these markets is you own those currencies, you own the money so you are exposed to currency risk."

There's no better example of that risk than a 5,000 ruble note taped to the side of Tipp's computer monitor. The note is from before 1998, when interest rates skyrocketed in Russia and the value of its currency crashed.

"That," he says, "is a little reminder."

Wednesday, April 26, 2006

A Brief History of Derivatives

The history of derivatives is quite colorful and surprisingly a lot longer than most people think. A few years ago I compiled a list of the events that I thought shaped the history of derivatives. That list is published in its entirety in the Winter1995 is sue of Derivatives Quarterly. What follows here is a snapshot of the major events that I think form the evolution of derivatives.

I would like to first note that some of these stories are controversial. Do they really involve derivatives? Or do the minds of people like myself and others see derivatives everywhere?

To start we need to go back to the Bible. In Genesis Chapter 29, believed to be about the year 1700 B.C., Jacob purchased an option costing him seven years of labor that granted him the right to marry Laban's daughter Rachel. His prospective father-in-law, however, reneged, perhaps making this not only the first derivative but the first default on a derivative. Laban required Jacob to marry his older daughter Leah. Jacob married Leah, but because he preferred Rachel, he purchased another option, requiring seven more years of labor, and finally married Rachel, bigamy being allowed in those days. Jacob ended up with two wives, twelve sons, who became the patriarchs of the twelve tribes of Israel, and a lot of domestic friction, which is not surprising. Some argue that Jacob really had forward contracts, which obligated him to the marriages but that does not matter. Jacob did derivatives, one way or the other. Around 580 B.C., Thales the Milesian purchased options on olive presses and made a fortune off of a bumper crop in olives. So derivatives were around before the time of Christ.

The first exchange for trading derivatives appeared to be the Royal Exchange in London, which permitted forward contracting. The celebrated Dutch Tulip bulb mania, which you can read about in Extraordinary Popular Delusions and the Madness of Crowds by Charles Mackay, published 1841 but still in print, was characterized by forward contracting on tulip bulbs around 1637. The first "futures" contracts are generally traced to the Yodoya rice market in Osaka, Japan around 1650. These were evidently standardized contracts, which made them much like today's futures, although it is not known if the contracts were marked to market daily and/or had credit guarantees.

Probably the next major event, and the most significant as far as the history of U. S. futures markets, was the creation of the Chicago Board of Trade in 1848. Due to its prime location on Lake Michigan, Chicago was developing as a major center for the storage, sale, and distribution of Midwestern grain. Due to the seasonality of grain, however, Chicago's storage facilities were unable to accommodate the enormous increase in supply that occurred following the harvest. Similarly, its facilities were underutilized in the spring. Chicago spot prices rose and fell drastically. A group of grain traders created the "to-arrive" contract, which permitted farmers to lock in the price and deliver the grain later. This allowed the farmer to store the grain either on the farm or at a storage facility nearby and deliver it to Chicago months later. These to-arrive contracts proved useful as a device for hedging and speculating on price changes. Farmers and traders soon realized that the sale and delivery of the grain itself was not nearly as important as the ability to transfer the price risk associated with the grain. The grain could always be sold and delivered anywhere else at any time. These contracts were eventually standardized around 1865, and in 1925 the first futures clearinghouse was formed. From that point on, futures contracts were pretty much of the form we know them today.

In the mid 1800s, famed New York financier Russell Sage began creating synthetic loans using the principle of put-call parity. Sage would buy the stock and a put from his customer and sell the customer a call. By fixing the put, call, and strike prices, Sage was creating a synthetic loan with an interest rate significantly higher than usury laws allowed.

One of the first examples of financial engineering was by none other than the beleaguered government of the Confederate States of America, which is sued a dual currency optionable bond. This permitted the Confederate States to borrow money in sterling with an option to pay back in French francs. The holder of the bond had the option to convert the claim into cotton, the south's primary cash crop.

Interestingly, futures/options/derivatives trading was banned numerous times in Europe and Japan and even in the United States in the state of Illinois in 1867 though the law was quickly repealed. In 1874 the Chicago Mercantile Exchange's predecessor, the Chicago Produce Exchange, was formed. It became the modern day Merc in 1919. Other exchanges had been popping up around the country and continued to do so.

The early twentieth century was a dark period for derivatives trading as bucket shops were rampant. Bucket shops are small operators in options and securities that typically lure customers into transactions and then flee with the money, setting up shop elsewhere.

In 1922 the federal government made its first effort to regulate the futures market with the Grain Futures Act. In 1936 options on futures were banned in the United States. All the while options, futures and various derivatives continued to be banned from time to time in other countries.

The 1950s marked the era of two significant events in the futures markets. In 1955 the Supreme Court ruled in the case of Corn Products Refining Company that profits from hedging are treated as ordinary income. This ruling stood until it was challenged by the 1988 ruling in the Arkansas Best case. The Best decision denied the deductibility of capital losses against ordinary income and effectively gave hedging a tax disadvantage. Fortunately, this interpretation was overturned in 1993.

Another significant event of the 1950s was the ban on onion futures. Onion futures do not seem particularly important, though that is probably because they were banned, and we do not hear much about them. But the significance is that a group of Michigan onion farmers, reportedly enlisting the aid of their congressman, a young Gerald Ford, succeeded in banning a specific commodity from futures trading. To this day, the law in effect says, "you can create futures contracts on anything but onions.”

In 1972 the Chicago Mercantile Exchange, responding to the now-freely floating international currencies, created the International Monetary Market, which allowed trading in currency futures. These were the first futures contracts that were not on physical commodities. In 1975 the Chicago Board of Trade created the first interest rate futures contract, one based on Ginnie Mae (GNMA) mortgages. While the contract met with initial success, it eventually died. The CBOT resuscitated it several times, changing its structure, but it never became viable. In 1975 the Merc responded with the Treasury bill futures contract. This contract was the first successful pure interest rate futures. It was held up as an example, either good or bad depending on your perspective, of the enormous leverage in futures. For only about $1,000, and now less than that, you controlled $1 million of T -bills. In 1977, the CBOT created the T -bond futures contract, which went on to be the highest volume contract. In 1982 the CME created the Eurodollar contract, which has now surpassed the T -bond contract to become the most actively traded of all futures contracts. In 1982, the Kansas City Board of Trade launched the first stock index futures, a contract on the Value Line Index. The Chicago Mercantile Exchange quickly followed with their highly successful contract on the S&P 500 index.

1973 marked the creation of both the Chicago Board Options Exchange and the publication of perhaps the most famous formula in finance, the option pricing model of Fischer Black and Myron Scholes. These events revolutionized the investment world in ways no one could imagine at that time. The Black-Scholes model, as it came to be known, set up a mathematical framework that formed the basis for an explosive revolution in the use of derivatives. In 1983, the Chicago Board Options Exchange decided to create an option on an index of stocks. Though originally known as the CBOE 100 Index, it was soon turned over to Standard and Poor's and became known as the S&P 100, which remains the most actively traded exchange-listed option.

The 1980s marked the beginning of the era of swaps and other over-the-counter derivatives. Although over-the-counter options and forwards had previously existed, the generation of corporate financial managers of that decade was the first to come out of business schools with exposure to derivatives. Soon virtually every large corporation, and even some that were not so large, were using derivatives to hedge, and in some cases, speculate on interest rate, exchange rate and commodity risk. New products were rapidly created to hedge the now-recognized wide varieties of risks. As the problems became more complex, Wall Street turned increasingly to the talents of mathematicians and physicists, offering them new and quite different career paths and unheard-of money. The instruments became more complex and were sometimes even referred to as "exotic."

In 1994 the derivatives world was hit with a series of large losses on derivatives trading announced by some well-known and highly experienced firms, such as Procter and Gamble and Metallgesellschaft. One of America's wealthiest localities, Orange County, California, declared bankruptcy, allegedly due to derivatives trading, but more accurately, due to the use of leverage in a portfolio of short- term Treasury securities. England's venerable Barings Bank declared bankruptcy due to speculative trading in futures contracts by a 28- year old clerk in its Singapore office. These and other large losses led to a huge outcry, sometimes against the instruments and sometimes against the firms that sold them. While some minor changes occurred in the way in which derivatives were sold, most firms simply instituted tighter controls and continued to use derivatives.

These stories hit the high points in the history of derivatives. Even my aforementioned "Chronology" cannot do full justice to its long and colorful history. The future promises to bring new and exciting developments.

Don Chance is a professor of finance at Louisiana State University He can be reached at dchance@fenews.com

For More Reading

Black, Fischer and Myron Scholes. "The Pricing of Options and Corporate Liabilities." The Journal of Political Economy 81,637-654.

Chance, Don M. "A Chronology of Derivatives." Derivatives Quarterly 2 (Winter, 1995), 53-60.

Mackay, Charles. Extraordinary Popular Delusions and the Madness of Crowds. New York; Harmony Books (1841, current version 1980).

This column is excerpted from “Essays in Derivatives” by Don Chance (John Wiley & Sons, 1998) under an agreement with the publisher by Financial Engineering News.

Back to Basics: Which Duration is Best?

Teri Geske
Senior Vice President, Product Development

Note: This Back-to-Basics column on Duration was first published in 1997. Based on a number of recent inquiries on this subject, we are republishing the article, which we’ve revised and updated for this issue.
Fixed income professionals have come to rely on Duration as the primary measure of interest rate risk for individual securities and portfolios. Yet this widely accepted measure is still subject to misinterpretation and misuse, partly because there are various forms of Duration one might encounter (some of them being far more informative than others). In this Back-to-Basics article, we explain the differences among these duration measures and the implications of relying on the wrong one when evaluating a bond or managing a portfolio’s exposure to interest rate risk. We also discuss whether or not Duration can be interpreted as a measure of time, and how Duration relates to Average Life.

First, we review three types of Duration that may be calculated for a bond and/or for a portfolio1 , namely Macaulay’s (also known as Modified Duration), Effective Duration (also known as Option-Adjusted Duration), and Duration-to-Worst. These are defined as follows 2 :

-Macaulay’s (Modified) Duration – the approximate percentage change in a bond’s price given a 1% change in its yield-to-maturity . The Macaulay’s duration formula is based on a pre-determined set of principal and interest cash flows computed to the bond’s final maturity date and does not recognize that those cash flows could be affected by changes in interest rates, including the exercise of one or more embedded options (calls, puts, optional prepayments, floating rate coupons, including any reset caps or floors, etc.).

-Duration-to-Worst– the approximate percentage change in a bond’s price given a 1% change in its yield-to-maturity or its yield-to-call, whichever is lower. Duration-to-Worst is the same as Macaulay’s duration except the pre-determined set of principal and interest cash flows are based on either the final maturity date, or a call date within the bond’s call schedule, whichever would result in the lowest yield to the investor – i.e., the Yield-to-Worst. (Note that for puttable bonds, one would use a “duration-to-best” computed from cash flows to the maturity date or to the put date, whichever results in the highest yield to the investor).

-Effective Duration – the average percentage change in a bond’s price, based on upward and downward parallel shifts in the underlying term structure of interest rates (typically the Treasury spot curve). By determining what the bond’s price would be, given higher/lower interest rate environments, the effective duration measure reflects the increasing or decreasing likelihood of any option exercise, including calls, puts, changes in prepayment speeds for mortgage-backed securities, and the higher probability of encountering any rate caps/floors for securities with adjustable coupons.

Given that the primary objective of duration is to explain a bond’s or portfolio’s price sensitivity to changes in interest rates, we can see that neither Macaulay’s (Modified) Duration nor Duration-to-Worst can be used for this purpose, because neither one reflects the fact that a bond’s cash flows can be affected by a change in interest rates. Macaulay’s Duration assumes a bond will always survive to the stated maturity date, regardless of any call or put options, or in the case of a mortgage-backed security, that prepayments will be constant, regardless of a change in interest rates. Consider a mortgage pass-through forecasted to prepay at a CPR% of 18% for the remainder of the mortgage pool’s life, and that these cash flows produce a Macaulay’s duration of 3.20. Can we reasonably estimate the impact of a 50bp change in interest rates on the pass-through using the approximation: (– Duration x interest rates) = 1.60%? No, because the duration of 3.20 ignores the fact that if interest rates fall, prepayments are likely to increase, and vice versa. A similar error occurs with callable and puttable bonds, where Macaulay’s duration fails to recognize the increasing value of the call option as rates fall (or the rise in the put option’s value as rates rise). For bonds with adjustable rate coupons, Macaulay’s duration doesn’t reflect the fact that as interest rates change, the coupon rate on the bond changes; in essence it treats all bonds as fixed rate instruments. If Macaulay’s Duration is used to compare a portfolio’s interest rate sensitivity relative to a benchmark and the portfolio (or the benchmark) contains securities with any type of embedded options, a significant tracking error is likely to occur.

What about Duration-to-Worst? Even though Duration-to-Worst seems to recognize the presence of an embedded call option, it does not reflect the fact that the value of the option, i.e., the likelihood the option will be exercised, fluctuates as interest rates change. Duration-to-Worst is like an On/Off switch – it either assumes the bond is definitely going to be called, or is definitely not going to be called, without allowing for uncertainty. Therefore, Duration-to-Worst either under- or overestimates a bond’s interest rate sensitivity by assuming that a call will or will not be exercised, regardless of the future interest rate environment and can be a highly unstable and misleading measure.

Consider a bond with a 7.50% coupon, maturing in 10 years, callable a year from now at a price of 103, currently priced at 103.45, with the following measures: Yield-to-Maturity – 6.526%; Yield-to-Call – 6.355%; Macaulay’s Modified Duration – 6.99; Duration-to-Worst – 1.02; Effective Duration – 3.00. Since the yield to the first call date (which is the worst possible call date in this example), is lower than the yield-to-maturity of the bond, the bond is “trading to call”. The Macaulay’s Modified Duration, which ignores the presence of the call option entirely, predicts the bond’s price will increase by approximately 6.99% (from 103.45 to 110.70) if interest rates decline by 1%. However, we know the price cannot rise that far since the bond is callable at 103 in a year, so the Macaulay’s duration is not a useful approximation of price sensitivity.

Duration-to-Worst suffers from a related flaw – it assumes that the bond’s status (i.e., trading to call or trading to maturity) will never change until it actually does. If the bond is currently trading to call, the Duration-to-Worst assumes the bond will definitely be called, regardless of any future change in interest rates; if the bond is trading to maturity, the Duration-to-Worst assumes the bond will never be called. So, Duration-to-Worst can “jump” back and forth, from either a fairly short duration based on the call date, out to the duration based on the maturity date as the bond “crosses over” from trading to call to trading to maturity. Let’s say that a 20bp increase in rates would cause this bond to trade to maturity, rather than to the call date. If we use Duration-to-Worst, that 20bp rise in rates would cause us to restate the bond’s duration from 1.02 to 6.99, an unrealistically large jump in price sensitivity for a small change in interest rates3 . Of course, neither Duration-to-Worst nor Modified Duration provides a good indication of the actual change the bond’s price would experience given a shift in the yield curve; for this, we must use Effective Duration, which reflects the impact of the value of embedded options on the bond’s price sensitivity.

The Effective Duration of a callable bond will always be less than the Macaulay’s duration, for the following reason: As interest rates fall, the call becomes more important to the behavior of the security and the increase in price that a decline in rates would otherwise cause is restricted by the presence of the call. On a percentage basis, this means the price of a callable bond increases by a smaller amount than the price of an otherwise identical but non-callable bond for a given decline in rates. Conversely, as interest rates rise the value of the embedded call option declines and therefore has less and less impact on the price of the bond. On a percentage basis, the price of a callable bond begins to decline by almost as much as that of a non-callable bond. When we remember that Duration is used to estimate a percentage change in price, we can see that the Effective Duration value must be smaller than the Macaulay’s Duration, which ignores the impact of the call feature on the bond’s price. Similar logic holds true for mortgage-backed securities, where prepayments can be viewed as “partial calls” (that are exercised somewhat inefficiently).

Effective Duration should not be viewed as a measure of time, although it is often spoken of in terms of “years”. For securities with no embedded options (where the Macaulay’s Modified Duration and Effective Duration will be equal), duration can be viewed as the weighted-average time until cash flows are received, where the weights are the present values of the cash flows themselves. However, since securities with embedded options have uncertain cash flows (with respect to amount and/or timing), it is not appropriate to view duration in terms of time. In fact, some securities, most notably CMO Interest-Only (IO) tranches, have an Effective Duration that is negative, which certainly cannot be viewed as a time increment (leaving the theory of relativity aside!). Effective Duration can be longer than the Average Life of a bond if the Average Life is computed to a call date; otherwise, Effective Duration will be shorter than Average Life4 .

Effective Duration is the only one of the duration measures discussed here that reflects the impact of embedded options on a bond’s interest rate sensitivity. We devote a great deal of effort and resources to provide our clients with robust effective durations (and the various models required to derive them) for all types of fixed income securities, portfolios and benchmark indices. BondEdge provides all three durations discussed in this article, i.e. Modified, Effective and “To-Worst” - we hope this review has helped in making an informed decision about how to use them.

1 The duration of a portfolio is the weighted-average (market value-weighted) of the durations of each bond in the portfolio.
2 Note that each of these measures describes the percentage change in a bond’s (or portfolio’s) value for a given change in rates, not the dollar price change. For bonds priced at par, the percentage change and the dollar price change are the same; for bonds priced away from par, a so-called “dollar duration” may be computed that describes the bond’s dollar price change given a change in rates. However, unless otherwise noted, the term “duration” refers to “percentage change in price”.

3 Although Duration-to-Worst is not an accurate measure of interest rate risk for securities and portfolios that contain embedded options, it is often used in the municipal market. This may be due to the fact that municipal portfolios have traditionally been managed to maximize reported yield, rather than on a total return basis. In the mid-1980’s to early 1990s, years in which interest rates declined, the average tax-exempt bond mutual fund consistently underperformed muni market benchmarks. In an earlier On-the-Edge article, we proposed the hypothesis that relying on Duration-to-Worst caused a widespread mis-estimation of the interest rate sensitivity of these funds, leading to this pervasive underperformance.

4With the possible exception of certain CMO tranches with extreme extension or contraction risk.

Back to Basics: Volatility and Option Valuation

Teri Geske
Senior Vice President, Product Development

BondEdge for Windows allows investment managers to evaluate the impact of a change in volatility rates for different market sectors across a diversified portfolio. Since volatility is a critical component of option valuation, we thought it would be appropriate to review why volatility estimates are important in fixed income portfolio analysis and how you can measure the sensitivity of your portfolios to a change in volatility.

First, a brief reminder of why volatility is so important. Option theory reveals that, all other things being equal, an increase in volatility causes the value of an option to increase. If I have an option to buy avocados for $2 each for the next 12 months, and the price of avocados has been unchanged at $1.50 for the past 20 years, my option is worthless. However, if avocado prices have ranged from $0.90 to $3.25 over the past few seasons, my option is quite valuable. In fixed income portfolio analysis, volatility affects the value of callable (and puttable) bonds, mortgage-backed securities subject to prepayments (the right to prepay a mortgage is an option), adjustable rate securities with embedded caps and any other securities whose cashflows are potentially sensitive to changes in the level of interest rates. Since most of these instruments represent a short position in the option (with the notable exception of bonds with put options), an increase in volatility would cause the price of the security to decline. Or, if we hold price constant we can see that an increase in volatility causes a decline in a security's option-adjusted spread (OAS).

Although everyone agrees that volatility is an important variable in option valuation, the proper technique to use when estimating volatility is a topic of debate. In general, volatility is measured using historical data, or is implied from observed market prices (or some combination of the two). In BondEdge, the default volatility parameters (expressed as annual percentages) are based on historical observations because total return managers typically focus on returns over a fairly long period of time, e.g. 3 to 6 months. Some market participants (such as traders) with a shorter time horizon prefer to use implied volatilities, and the Volatility Appraisal report allows the portfolio manager to evaluate the impact of using different volatility assumptions on the duration and convexity of a portfolio. In fact, volatility estimates are often the primary cause of variations when comparing effective duration, convexity and OAS values from different sources.

While we typically use the term "volatility" in its singular form, to be more precise we should use the plural "volatilities", because the level of volatility differs along the term structure. Short term interest rates are generally more volatile than long term rates, and the analytical models in BondEdge take this into account by using different volatility rates along the term structure. The Volatility Appraisal report (under Portfolio-Simulation) allows you to specify the long and short rate volatilities for different segments of the market. Holding price constant, the effective duration, convexity and OAS of each security and of the portfolio are re-computed using the revised volatility estimates. The volatility parameters may also be modified in both Parallel and Specified Scenario portfolio simulations, where BondEdge calculates the total return, effective duration, convexity and other characteristics for the selected portfolio using the new volatility inputs. These features offer a portfolio-level analysis to complement the Security Valuation tool which allows you to analyze changes in volatility estimates (and other model parameters) for a single security.

Another way of measuring the impact of volatility on security valuation is described by the concept of Vega. Vega is defined as the price sensitivity to changes in volatility; securities (or portfolios) with a high degree of optionality have relatively high Vegas, whereas a security with no embedded options has a Vega of 0.00. Vega is one of the Risk Measures which may be computed in the Valuation screen or at the portfolio level using the Risk Measures report under the Simulation menu. We encourage you to use both Vega and the Volatility Appraisal and Simulations to understand how changes in volatility affect a diversified portfolio of securities with embedded options. As always, we welcome your feedback on this issue and invite you to suggest other topics for discussion.

Back to Basics: Value at Risk (VaR)

Teri Geske
Senior Vice President, Product Development


Over the past few years a tremendous amount of work has been done in the area of "Value at Risk" (referred to as "VaR" or "V-A-R"). There have been countless seminars and conferences on VaR, many books and articles have been written on the subject and there is no shortage of vendors touting their VaR systems as the sin qua non of risk management. VaR was originally designed for banks with significant trading operations covering several markets (fixed income, foreign exchange, derivatives, etc.) to quantify the institution’s risk in a systematic way. VaR is now used not only as an internal management tool, it has been adopted by international bank regulators in determining whether or not an institution is adequately capitalized. Although VaR has been embraced by most large banks, other members of the financial community (insurance companies, investment managers and plan sponsors) are still determining how, if at all, VaR fits into their business. Nonetheless, even though your firm may not yet be using VaR, it is a concept that is most likely here to stay. Therefore, we thought it might be useful to review the basics of VaR , including some of the strengths and weaknesses of this approach to risk management.

VaR is defined as the expected loss in value, given a statistical level of confidence, due to adverse movements in underlying risk factors. VaR allows us to state that "over the next x days, the portfolio is expected to lose no more than $y (or y%) in value with z% confidence" where z% is typically 95% or 99% (the Bank for International Settlements (BIS) standards use VaR in terms of a 3-day horizon with a 99% confidence interval.). Now, the statement that "99% of the time losses will not exceed $y" may sound rather comforting, but this also means that 1% of the time (one out of a hundred observations) we expect that losses will exceed the dollar value resulting from the VaR analysis. If we are using a 1-day VaR and a 99% confidence level, given that there are about 200+ trading days in a year we are saying that losses will be more severe than the VaR amount approximately twice a year. Furthermore, VaR says nothing about how bad the loss might be that 1% of the time – this is why risk managers realize that VaR should be combined with stress testing to determine what might happen under extreme conditions.

There are three approaches used to compute VaR, referred to as the "variance/covariance", "historical simulation" and "Monte Carlo simulation" methods. We will briefly summarize them here, mentioning some strengths and weaknesses of each. The variance/covariance approach assigns (or "maps") each asset to one or more equivalent risk position based on the factor(s) that affect the asset’s value. For example, a portfolio consisting of a 5 year bond and futures contracts on the S&P500 and would be represented as exposures to movements in the five year U.S. interest rate and the S&P500. The VaR of the portfolio is computed based on the variance and covariance of the individual risk factors over the VaR time horizon. So, if the daily change in the 5 year U.S. Treasury rate has a standard deviation of 4bps, the interest rate risk component of the portfolio’s one-day VaR with a 99% confidence interval would be based on a 2.33x4bp approximately 9bp move. To compute VaR (in dollars), the change in each risk factor associated with the chosen confidence level is multiplied by the "delta equivalent" value of the position – for fixed income securities, this is the dollar-duration (i.e., the change in dollar value given a small change in interest rates). If there is some negative correlation among the risk factors (e.g. if the S&P500 tends to move up when the Treasury prices go down and vice versa), the covariance between these risk factors would make the VaR of the portfolio something less than the sum of the VaRs of two separate portfolios, one holding the S&P500 futures and the other a 5 year Treasury.

The primary advantage of the variance/covariance approach is that it is fairly easy to compute. There are a number of sources of variances and covariance "matrices" for key risk factors (exchange rates, interest rates, commodity prices, etc.) that can be downloaded into spreadsheet programs designed to compute VaR using this method. However, there are a number of drawbacks to this approach; the most important for fixed income portfolios is that the price sensitivity of options, or of bonds with embedded options (callable bonds, mortgage-backed securities, etc.) cannot be adequately described by the variance/covariance method. This method implicitly assumes that prices change at a constant rate with respect to a change in a market risk factor, but this assumption is not valid for options. The price behavior of options is "non-linear" – in other words, not constant. For example, as interest rates rise a mortgage-backed security’s duration (its sensitivity to interest rate risk) can increase considerably due to a change in the value of the embedded prepayment option. The variance/covariance approach does not capture this and can significantly underestimate the true VaR for a portfolio containing options.

The Historical Simulation VaR method observes the actual level of market risk factors (such as yield curves, exchange rates, commodity prices, etc.) over a period of time and revalues each asset in the portfolio given each observed risk factor. For example, if a portfolio consisted solely of 30 year zero coupon bonds, we would observe the 30 year Treasury (spot) rate over each of the past 100 days and would revalue the portfolio 100 times, given these different interest rate levels. A one-day VaR with 95% confidence would be computed as the 5th largest decline in the portfolio’s value of the 100 daily observations. One advantage to this approach over the variance/covariance method is that it does reflect the non-linear price behavior of options. A disadvantage of the historical simulation method is that the VaR number is highly sensitive to the time period used to observe the market risk factors. For example, the VaR of a corporate bond portfolio calculated as the 5th worst loss using six months of credit spread changes observed over two years from June 1996 – June 1998 would be markedly different than the 5th worse loss over the two years from January 1997 to January 1999.

The Monte Carlo VaR approach overcomes the historical method’s dependence on a particular time period by generating a (random) distribution of changes in each key market risk factor based on parameters specified for each factor. The portfolio is revalued under each set of market conditions generated by the Monte Carlo simulation and, as with the Historical method, the changes in portfolio value are ordered so that the VaR is observed as the loss in value corresponding to the desired confidence level, e.g., the 5th worst loss out of one hundred observations for a 95% confidence level. The Monte Carlo approach is quite robust but requires the most sophisticated analytical systems and the greatest data collection effort.

Some problems with VaR: In addition to the drawbacks of each method cited above, VaR suffers from a number of shortcomings. First, the three calculation methods can produce radically different results – this makes it difficult (if not impossible) to compare VaR numbers reported by different institutions. There is the issue raised earlier that even a 99% confidence level says nothing about how severe the loss might be at the "tail" of the distribution. Two firms (or two portfolios) might have the same VaR at a 95% confidence interval, but at the 96th percentile one’s loss might be twice as large as the other’s. If a firm relies exclusively on VaR for risk management, the potential for catastrophic loss due to extreme changes in risk factors could grow unchecked over time. That possibility leads us back to the importance of stress testing as mentioned earlier. There are many other practical as well as theoretical issues to address in deciding which (if any) VaR analysis to use, and there is no shortage of financial literature devoted to the topic.

Finally, we should ask ourselves, is VaR appropriate for investment management? Traditionally, the time horizon for VaR analyses has been measured in terms of days (one day, three days, a week) and in terms of dollar value. Since investment managers typically measure performance monthly, and usually relative to a benchmark, a one-month "relative" VaR might be more appropriate. Using this approach, a VaR analysis using a 99% confidence level would state that in one month out of 100 the portfolio is expected to underperform by more than y% relative to a benchmark. Frankly, it becomes increasingly difficult to compute, back-test and interpret VaR numbers for these longer time horizons because the necessary data is difficult to collect. In this example, back testing would require us to collect 8+ years of monthly observations before we could determine whether or not our actual loss exceeded our computed VaR more than 1% of the time. Over that lengthy period, the parameters used to compute the original VaR number may no longer reflect actual market conditions and the portfolio’s exposure to different risk factors would most likely change. So, perhaps it is better to stay with short VaR time horizons despite the longer-term perspective of most investment managers.

Despite these drawbacks, VaR can be a useful tool. It promotes risk awareness, can be used to evaluate a firm’s risk profile over time or to compare asset managers across different sectors and so on.

對沖基金與信評

對沖基金與信評 Hedge Funds' Next Wrinkle: Ratings 對沖基金最近已經夠倒楣了, 現在又出現了下一個難關 --- 信評. 我有一個很聰明又很會賺錢的朋友Aaron在對沖基金作的很好, 他曾不只一次在閒談中擔心對沖基金的好景不再. (那...